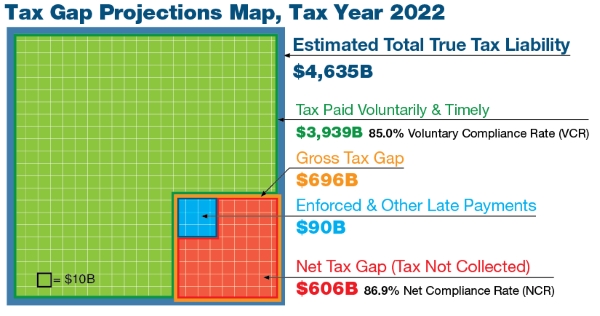
The gross tax gap is the difference between true tax liability for a given tax year and the amount that is paid on time. It is comprised of the nonfiling gap, the underreporting gap, and the underpayment (or remittance) gap. The net tax gap is the portion of the gross tax gap that will never be recovered through enforcement or other late payments.
The gross tax gap is the amount of true tax liability that is not paid voluntarily and timely. The projected annual gross tax gap for TY 2022 is $ 696 billion. The voluntary compliance rate (VCR) is a ratio measure of relative compliance and is defined as the amount of “tax paid voluntarily and timely” divided by “total true tax,” expressed as a percentage. The projected VCR is 85.0 percent.
The TY 2022 gross tax gap comprises three components
- Nonfiling (tax not paid on time by those who do not file on time) $63 billion,
- Underreporting (tax understated on timely filed returns) $539 billion, and
- Underpayment (tax that was reported on time, but not paid on time) $94 billion.
The TY 2022 gross tax gap by type of tax
- Individual income tax $514 billion,
- Corporate tax $50 billion,
- Employment tax $127 billion, and
- Estate tax $5 billion.
Tax gap release schedule
- Fall of calendar year 2024—new tax gap projections
- Fall of calendar year 2025—new tax gap estimates and projections (delayed)
Tax gap projections for tax years 2022
- Tax Gap Projections for Tax Year 2022 (Publication 5869) PDF
- Tax Gap Projections Map for Tax Year 2022 (Publication 5870) PDF
- Tax Gap Projections Methodology for Tax Year 2022 (Publication 6031) PDF
A particular challenge for tax gap estimation is the time it takes to collect certain compliance data, especially data on underreporting that come from completed examinations. Waiting for the data to become available allows the estimates to reflect the compliance behavior for the years of the estimates, but by then the time frame of the estimates can be several years prior to the year of the tax gap release.
To address this issue, we developed tax gap projections as a bridge between the competing priorities of the need for more contemporaneous tax gap estimates and having tax gap estimates based on compliance data for the time frame of the estimates.
Differences between the estimation methods used to produce the tax gap estimates and the projections vary by component, reflecting the timing in which compliance data become available for use in estimation. For example, the projections of the underreporting tax gap generally reflect the level of the tax gap that takes into account the growth in the reported tax or the reported amount of line items on tax returns while assuming compliance behavior has not changed from prior years.
Tax gap projections for tax years 2020 and 2021
- Tax Gap Projections for Tax Years 2020 and 2021 (Publication 5869) PDF
- Tax Gap Projections Map for Tax Years 2020 and 2021 (Publication 5870) PDF
Tax gap estimates for tax years 2014–2016 and projections for 2017–2019
- Tax Gap Estimates for Tax Years 2014–2016 (Publication 1415) PDF
- Tax Gap Executive Summary (Publication 5364) PDF
- Tax Gap Map (Publication 5365) PDF
- The Underpayment Tax Gap for Tax Years 2014–2016 (Publication 5783) PDF
- Distribution of Tax Year 2014–2015 Individual Income Tax and Self-Employment Tax Underreporting Tax Gap PDF
- Estimation of the Underreporting Tax Gap for Tax Years 2014–2016: Methodology (Publication 5784) PDF
- The Individual Income Tax and Self-Employment Tax Nonfiling Tax Gaps for Tax Years 2014–2016 (Publication 5785) PDF
- The Net Tax Gap for Tax Years 2014–2016 (Publication 5786) PDF
Tax gap estimates for tax years 2011–2013
- Tax Gap Estimates for Tax Years 2011–2013 (Publication 1415) PDF
- Tax Gap Executive Summary (Publication 5364) PDF
- Tax Gap Map (Publication 5365) PDF
Tax gap estimates for tax years 2008–2010
Tax gap estimates for tax years 2006
- Overview of the Tax Gap for Tax Year 2006 PDF
- Summary of Tax Gap Estimation Methods PDF
- Tax Gap Map PDF
- Tax Year 2006 Tax Gap Estimation PDF
- Estimates of the Tax Year 2006 Individual Income Tax Underreporting Gap PDF
- Advances in Nonfiling Measures PDF
Tax gap estimates for tax years 2001
Tax gap estimates for earlier tax years
- Federal Tax Compliance Research: Individual Income Tax Gap Estimates for 1985, 1988, and 1992 PDF
- Federal Tax Compliance Research: Gross and Net Employment Tax Gap Estimates for 1984–1997 PDF
- Income Tax Compliance Research: Net Tax Gap and Remittance Gap Estimates PDF
- Gross Tax Gap Estimates and Projections for 1973–1992 PDF
Tax gap related methods
This section includes papers that focus on estimation methods that have been used for estimating the tax gap, though these papers do not contain tax gap estimates.
- Statistical Analysis of Compliance Using the NRP Data: Detection Controlled Models PDF
- Developing an Econometric Model for Measuring Tax Noncompliance Using Operational Audit Data PDF
Reports on reducing the tax gap
These reports have been written by the Department of the Treasury and IRS to describe current and planned efforts to reduce the tax gap.

 )
or https:// means you've safely connected to the .gov website. Share sensitive information only on official, secure websites.

